Adblocker Detected

We always struggled to serve you with the best online calculations, thus, there's a humble request to either disable the AD blocker or go with premium plans to use the AD-Free version for calculators.
Disable your Adblocker and refresh your web page 😊
How Was Your Calculator Experience? ![]()

We'd Welcome your Feedback
Thank you for visiting our website. You have been selected to participate in a brief customer satisfaction survey to let us know how we can improve your experience
No, Thanks
Table of Content
The pie chart calculator determines the percentage and the degree of the angles of the statistical data. Just enter the values of the variables in the percentage chart calculator to identify all relative percentages and angles in degrees.
A pie chart is a type of graph that is used to represent the data in a circular diagram. The wedges of the pie chart represent the pictorial representation of various variables.
Each variable has a certain portion of a certain pie chart percentage and is represented by a certain color in the 360-degree circle. The pie chart calculator needs a list of categorical variables and their numerical values to make a certain pie chart.
The formula for the pie chart with percentages of each variable is given by:
Percentage of variables = (Each variable /Total data values) × 100
Now for finding the angle of each variable in degrees:
Angle of variables = (Each variable /Total data values) × 360°
Pie charts are the graphical representation of the data in which data is distributed. The pie chart provides an accurate and clear representation of the data.
Step 1:
Identify all the variables in the pie chart and find the relative count of each of the variables.
Step 2:
Sum all the variables in the pie chart to find the total sum of all the values of the variables.
Step 3:
Divide each value by the total ad multiplied with the 100, to find the percentage pie chart maker of each variable.
Step 4:
In the last step, you need to find how many degrees for each variable should be allocated. This can be done by multiplying with the 360 degrees.
Let’s suppose the favorite sport of each student in a class of 40.
Football 10, Hockey 5, Cricket 5, Basketball 10, and Badminton 10. Now represent the data in the form pie chart percentage of each student’s favorite sports and the relative angle.
A = Football = 10
B = Hockey = 5
C = Cricket = 5
D = Basketball = 10
E = Badminton =10
The percentages of the variable of various games are:
A = Football = (10/40) 100 = 25%
B = Hockey = (5/40) = 12.5 %
C = Cricket = (5/40) = 12.5 %
D = Basketball = (10/40) 100 = 25%
E = Badminton =10/40) 100 = 25%
The angles of the variable of various games are:
A = Football = (10/40) 360° = 90°
A = Hockey= (5/40) 360° = 45°
A = Cricket = (5/40) 360° = 45°
A = Basketball = (10/40) 360° = 90°
A = Badminton = (10/40) 360° = 90°
The percentage and angle of the variable are given in the table below:
| Group | Games | Values | Percentage | Angle |
| A | Football | 10 | 25 % | 90° |
| B | Hockey | 5 | 12.5 % | 45° |
| C | Cricket | 5 | 12.5 % | 45° |
| D | Basketball | 10 | 25 % | 90° |
| E | Badminton | 10 | 25 % | 90° |
The favorite game of the students the percentage pie chart and the angles of each game are given in the chart below:
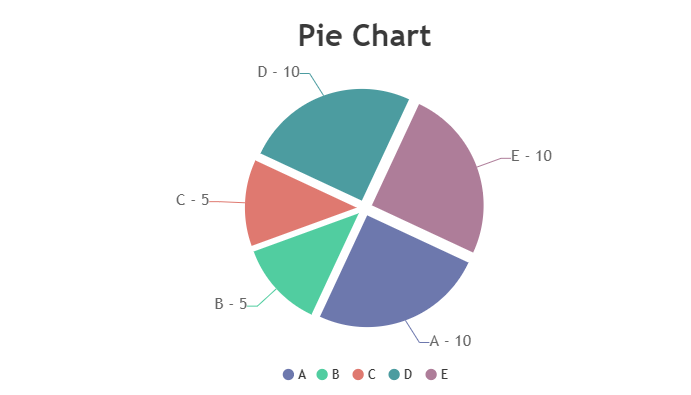
You can calculate the relative percentage of each game and their angles with the percentage pie chart calculator. The pie chart makes it possible to understand the percentage of each variable from the total percentage.
The pie chart percentage maker reveals the following data for the users:
The pie chart percentage of each variable from the total of all the values.
The relative angle of each variable is calculated by multiplying it by 360 degrees.
The pie chart percentage calculator calculates the pictorial representation of the data variable and their percentage along with the relative angle.
The other name of the pie chart is a circle chart. It is a way of summarizing a set of nominal data or displaying the different values of a given variable in the form of a pie chart with percentages.
Column chart: It is used for comparing data across categories.
Pie Chart: fUsed to show the relative shares of categories in a total
The pie charts are divided into two forms,
The pie chart maker percentages provide 2D pie charts to show the relative share of the data values.
From the source of Wikipedia: Pie chart
From the source of chartio.com: What is pie Chart?
Get the ease of calculating anything from the source of calculator online
Apart from calculations, convert files with:


© Copyrights 2024 by Calculator-online.net
