Adblocker Detected

We always struggled to serve you with the best online calculations, thus, there's a humble request to either disable the AD blocker or go with premium plans to use the AD-Free version for calculators.
Disable your Adblocker and refresh your web page 😊
How Was Your Calculator Experience? ![]()

We'd Welcome your Feedback
Thank you for visiting our website. You have been selected to participate in a brief customer satisfaction survey to let us know how we can improve your experience
No, Thanks
Table of Content
The sample distribution calculator helps to calculate the probability distribution for a sample of statistics that lies within a specific range.
The sampling distribution is a probability distribution of the dataset values of the whole population. The sampling distribution of a given population is the distribution of the frequencies of a specific range.
In statistics, a sample is selected from a population, sampling distribution represents the probability of the occurrence of the whole population. The sample distribution calculator computes probabilities associated with the sampling distribution of the sample of a specific population.
The sample distribution is critical to conduct as it assists us to understand the whole population’s behavior. The main reason is that the sample distribution actually represents the whole population. In business and commerce, it carries great importance to find the sample distribution of the population to know the response of the whole marketplace.
The sample distribution calculator finds the sampling distribution and the probability of the sample mean that lies within a specific range. Use this random sample probability calculator to estimate the probabilities associated with the sampling distribution.
The sample distribution can be used for:
The probability of consumer response is essential to identify before floating a product in a marketplace. The sample mean probability calculator can be a great resource in winning a marketplace as you know the exact needs and wants of the consumer through using this tool.
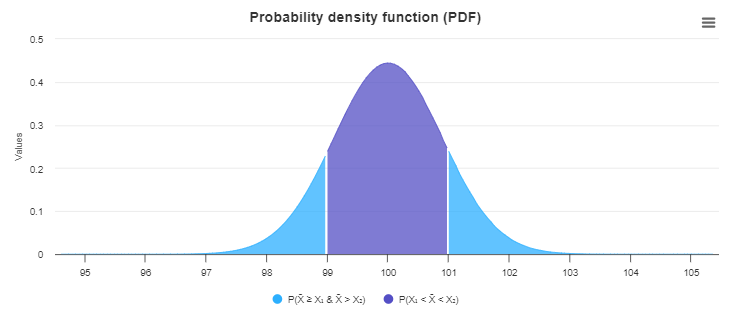
Let’s suppose the population means of the sample data are 100 and the standard deviation is 5. The sample size is 31. Suppose the probability event is \(Pr(99 \le \bar{X} \le 101\). Then what is the sampling distribution of the data sample?
Sample size = 31
Standard deviation = 5
Population mean = 100
The following dataset represents the population means (μ), population standard deviation (σ), and sample size (n):
| Population Mean (μ) = | 100 |
| Population Standard Deviation (σ) = | 5 |
| Sample Size (n) | 31 |
| Probability Event = | 99<=X<100<=/td> |
Here, we are required to find a probability event which is \(Pr(99 \le \bar{X} \le 101\). The probability of sample mean calculator assists you to find the probability that the sample mean falls below or above a specific random range.
The lower probability score of the sample is:
Z_{lower} = \dfrac{X_1 – μ}{σ / \sqrt{n}} = \dfrac{99 – 100}{5 / \sqrt{31}} = -1.114
The upper probability score of the sample is:
Z_{upper} = \dfrac{X_2 – μ}{σ / \sqrt{n}} = \dfrac{101 – 100}{5 / \sqrt{31}} = 1.114
Now by applying the properties of the normal distribution, You can find whether the sampling distribution is normal or not. The standard deviation of the sampling distribution calculator makes it possible to know whether the sampling distribution is normal or not.
Pr(99 \le \bar{X} \le 101) = Pr \left(\dfrac{99 – 100}{5 / \sqrt{31}} \le \dfrac{\bar{X} – 100}{5 / \sqrt{31}} \le \dfrac{101 – 100}{5 / \sqrt{31}} \right)
\(= Pr \left(\dfrac{99 – 100}{5 / \sqrt{31}} \le Z \le \dfrac{101 – 100}{5 / \sqrt{31}} \right\)
\(= Pr (-1.114 \le Z \le 1.114\)
\(= Pr (Z \le 1.114) – Pr(Z \le -1.114\)
= 0.8673 – 0.1327
= 0.7345
By the information provided, it is concluded What is the \(Pr(99 \le \bar{X} \le 101) = 0.7345\)
The following equation can also be obtained by the graph given below:
The mean of sampling distribution calculator calculates the mean value for a sample mean, based on a population mean and also the standard deviation of the population.
For calculating the sample distribution of the sample by the sampling distribution calculator. Follow the steps below.
Input:
Output:
Sampling is an essential tool in statistics and research as it enables us to know the response of the whole population. You can predict the expected response of the whole population on the basis of sampling distribution. You can identify the sample means and distribution by the distribution of the sample mean calculator.
The two major types of sampling are:
Sampling errors may occur as the sample is representing a huge population. But it can be reduced by careful selection of datasets from the population. The randomness of the sample can be removed by the random sample probability calculator to make the sample selection more accurate.
A good maximum sample size is usually around 10% of the population, as long as this does not exceed 1000. For example, in a population of 5000, 10% would be 500.
From the source of investopedia.com: Sampling distribution, What is normal distribution?
From the source of Wikipedia: Sample distribution, Standard error
Get the ease of calculating anything from the source of calculator online
Apart from calculations, convert files with:


© Copyrights 2024 by Calculator-online.net
