Adblocker Detected

We always struggled to serve you with the best online calculations, thus, there's a humble request to either disable the AD blocker or go with premium plans to use the AD-Free version for calculators.
Disable your Adblocker and refresh your web page 😊
Table of Content
This Standard deviation calculator helps to compute the sample standard deviation and population standard deviation. It also shows the value of variance, mean, sum, and difference.
Input a data set separated by commas into the standard deviation finder, choose the sample or population, click calculate, and it will calculate the standard deviation and provide you with a thorough result.
Let’s dive deeper into crucial aspects such as standard deviation definition, measuring standard deviation, and the equation of standard deviation.
“It is the square root of the variance of any statistical data set”
The standard deviation indicates the measure of variance in a data set. In statistics, it informs about how far each observed value is from the mean. It is used for determining the population variability, margin of error, and much more!
Having a low or small standard deviation indicates that the data is packed near the mean and a high or large deviation means that the data is largely dispersed from the mean, showing greater variance.
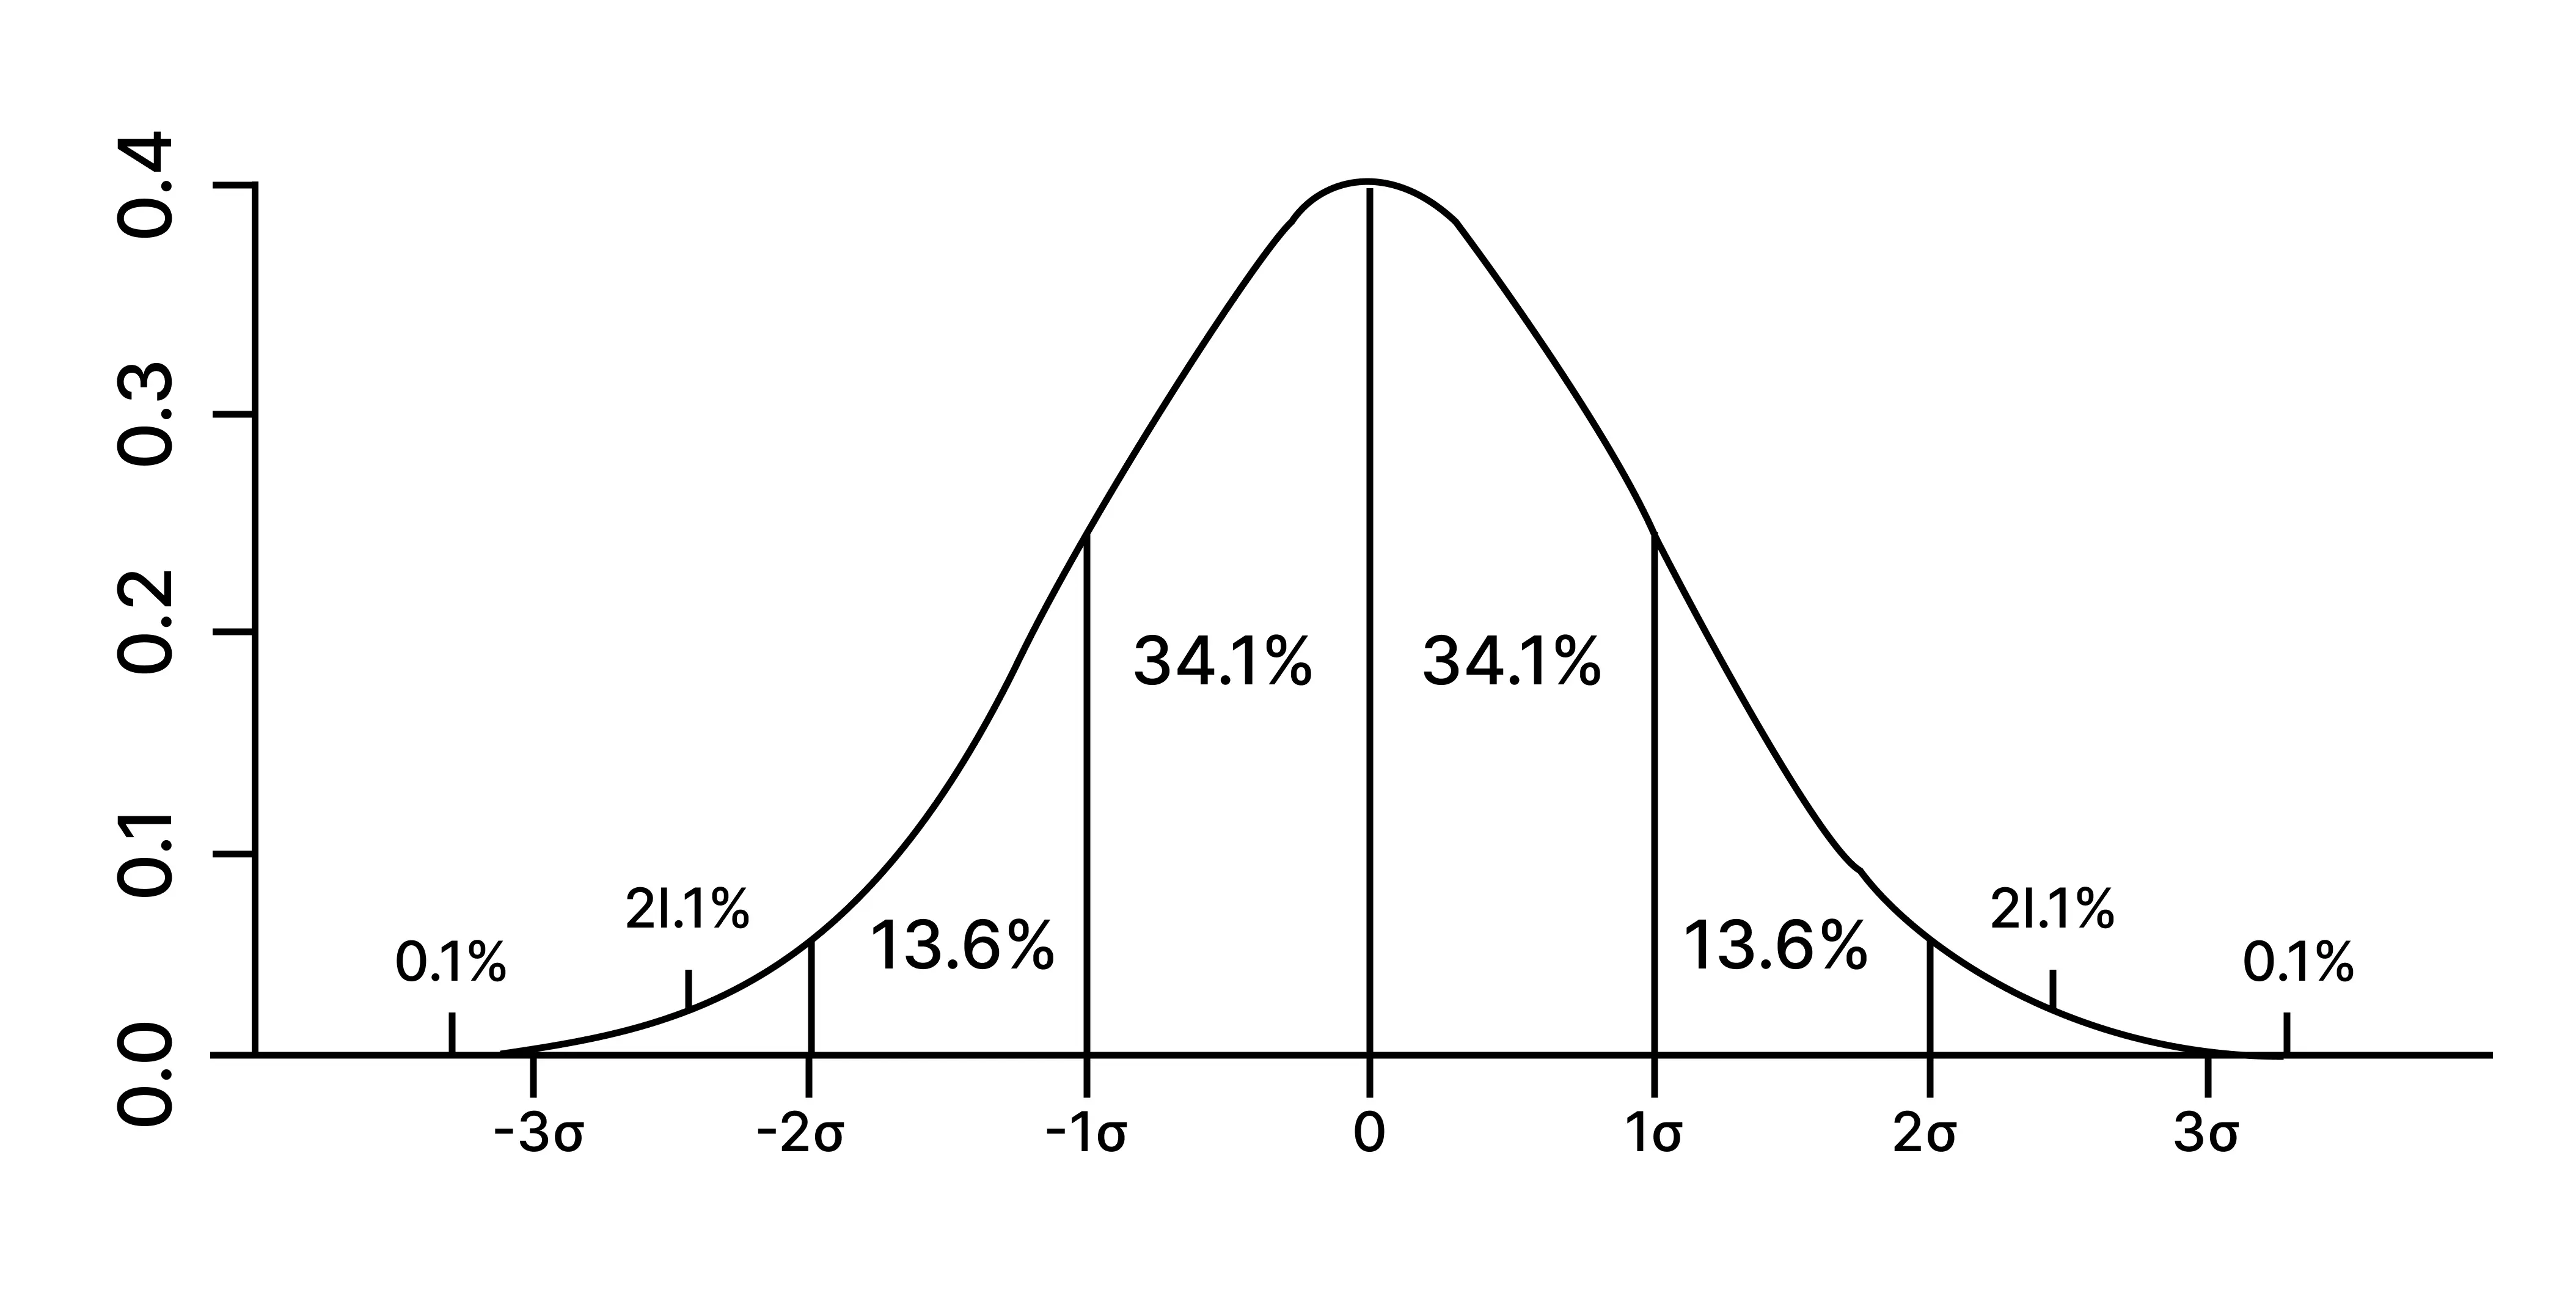
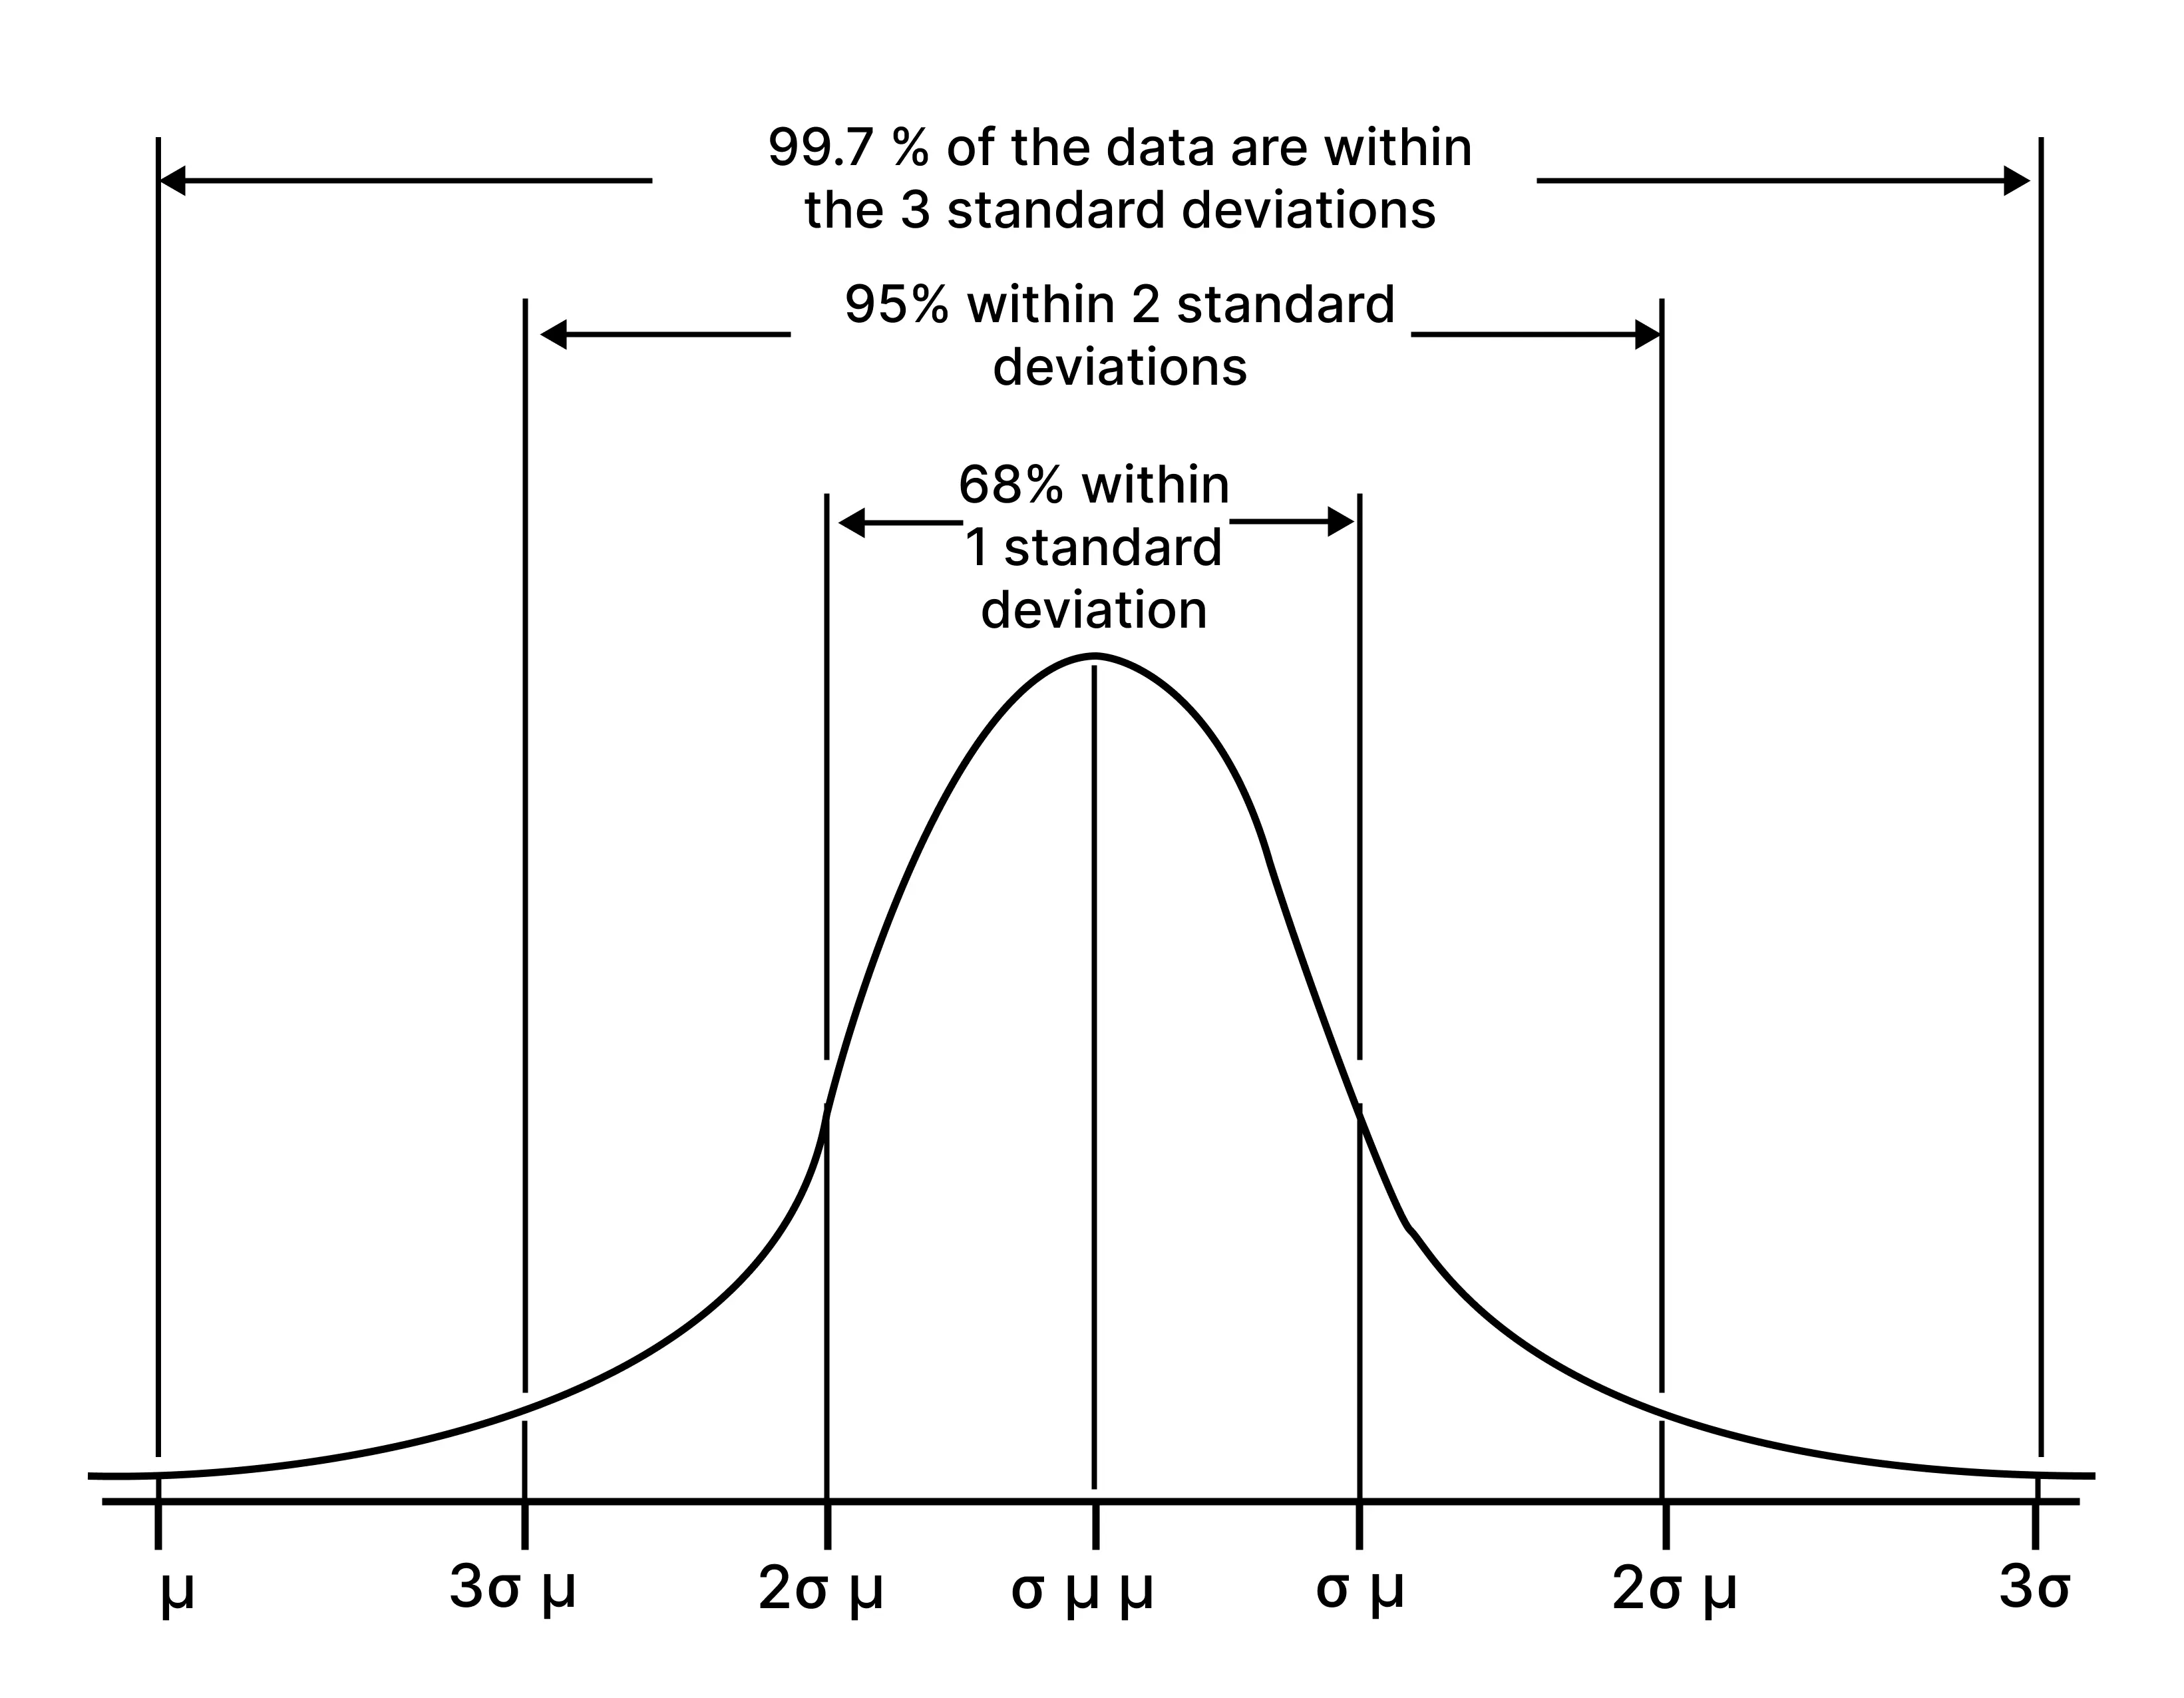
The symbol that is used to represent standard deviation is “σ”. In most of the distributions, about 95% of values lie within 2 standard deviations as defined by the empirical rule.

This rule provides a quick overview of your data set. It informs you about where most of the values are present in a normal distribution:

The Standard Deviation calculator utilizes the following formulas to calculate data dispersion around a central tendency:
The following population standard deviation formula is used when all the members of the population can be sampled:
\(\ σ = \sqrt{\dfrac{1}{N} \sum_{i=1}^N\left(x_{i} – μ\right)^2}\)
Where
Keep in mind, sometimes it is not possible to sample all the members of the populations so for that reason, the relative standard deviation equation is modified as you can see below:
\(s = \sqrt{\dfrac{1}{N – 1} \sum_{i=1}^N\left(x_{i} – \bar{x}\right)^2}\)
Where
The simple interface of the STD calculator makes your calculations super fast and 100% accurate! What you need to do includes:
Inputs:
Outputs:
Follow the below-mentioned steps to perform the manual calculations:
How to find the standard deviation for the following raw sample data set:
( 3, 4, 9, 7, 2, 5 )
Step 1(Calculate Mean Value):
\(\bar{x} = {\dfrac{3 + 4 + 9 + 7 + 2 + 5}{6}}\)
\(\bar{x} = \dfrac{30}{6}\)
\(\bar{x} = 5\)
Step 2 (Calculate The Value Of \(\left(x_{i} – \bar{x}\right)\):
\(x_1-\bar{x} = 3 – 5 = -2\)
\(x_2-\bar{x} = 4 – 5 = -1\)
\(x_3-\bar{x} = 9 – 5 = 4\)
\(x_4-\bar{x} = 7 – 5 = 2\)
\(x_5-\bar{x} = 2 – 5 = -3\)
\(x_6-\bar{x} = 5 – 5 = 0\)
Now we have:
\((x_1-µ)^2 = (-2)^2 = 4\)
\((x_2-µ)^2 = (-1)^2 = 1\)
\((x_3-µ)^2 = (-4)^2 = 16\)
\((x_4-µ)^2 = (2)^2 = 4\)
\((x_5-µ)^2 = (-3)^2 = 9\)
\((x_6-µ)^2 = (0)^2 = 0\)
Our standard deviation calculator automatically determines all of these values without creating any difficulty for you.
Step 3 (Calculate Sample Standard Deviation):
Now we know that:
\(s = \sqrt{\dfrac{1}{N – 1} \sum_{i=1}^N\left(x_{i} – \bar{x}\right)^2}\)
\(s = \sqrt {\dfrac { 4+1+16+4+9+0}{ 6-1}}\)
\(s = \sqrt {\dfrac { 34 }{5}}\)
\(s = \sqrt {6.8}\)
\(s = 2.60\)
It is useful because:
Measuring the degree of variability by standard deviation calculator enables researchers and statisticians to analyze the consistency of a data phenomenon around the mean. The technique helps them perform more accurate predictions and strategic planning.
In a normal distribution, the high value of standard deviation informs that the values are away from the mean, and a low value indicates that the data set values are near the mean(expected value).
Variance means the average squared deviations and the square root of this, is the average standard deviation. They both reflect the variability.
From the source of Wikipedia: General understanding and basic examples
From the site of scribbr.com: Formulas for population and sample standard deviation