Adblocker Detected

We always struggled to serve you with the best online calculations, thus, there's a humble request to either disable the AD blocker or go with premium plans to use the AD-Free version for calculators.
Disable your Adblocker and refresh your web page 😊
How Was Your Calculator Experience? ![]()

We'd Welcome your Feedback
Thank you for visiting our website. You have been selected to participate in a brief customer satisfaction survey to let us know how we can improve your experience
No, Thanks
Table of Content
An online correlation coefficient calculator will help you to find the correlation coefficient from the set of bivariate data. There are two different methods available in the coefficient of determination calculator for evaluating the correlation between the datasets with the graphical representation. In the following context, you can learn how to find correlation coefficient with some examples and much more.
It can be said that there is a correlation or statistical association between two variables, and the value of one variable can at least partially predict the value of the other variable.
Correlation is the standardized covariance, and the correlation ranges from -1 to 1.
If X depends on Y or Y on X or both variables depend on the third variable Z, the correlation ignores the problem of cause and effect. Similarly, for the covariance of independent variables, the correlation is zero.
Positive correlation: The changes are in the same direction, when one variable increases, the second variable usually increases, and when one variable decreases, the second variable usually decreases.
Negative Correlation: In the opposite direction, when one variable increases, the second variable decreases, and when one variable decreases, the second variable usually increases.
Perfect Correlation: When you know the value of a variable, you can calculate the exact value of the second variable. For perfect positive correlation r = 1, and a perfect negative correlation r = 1.

The correlation coefficient is a statistical concept that helps to establish the relationship between the predicted value and the actual value obtained in statistical experiments. The calculated value of the correlation coefficient explains the accuracy between the predicted value and the actual value.
The value of the correlation coefficient is always between -1 and +1. When the value of the correlation coefficient is positive, then there is a similar and identical relationship between the two variables. Else it indicates the difference between the two variables.
The product of the covariance of two variables divided by their standard deviations gives the Pearson correlation coefficient, usually called ρ (rho).
ρ (X, Y) = cov (X, Y) / σX. Y.
where,
cov = covariance
σX = standard deviation of X
σY = standard deviation of Y.
The equation of the correlation coefficient can be expressed by the mean value and the expected value.
The linear correlation coefficient defines the relationship between two different variables and is denoted by “r”. It is also known as the Cross-correlation coefficient as it predicts the relationship between different datasets.
If x & y are the two variables, then the linear correlation coefficient calculator can be calculate the correlation using the formula:
$$r=\dfrac{\sum{(x_i-\bar{x})(y_i-\bar{y})}}{\sqrt{\sum{(x_i-\bar{x})^2}\sum{(y_i-\bar{y})^2}}}$$
Here’s an example for calculating the correlation coefficient.
Example:
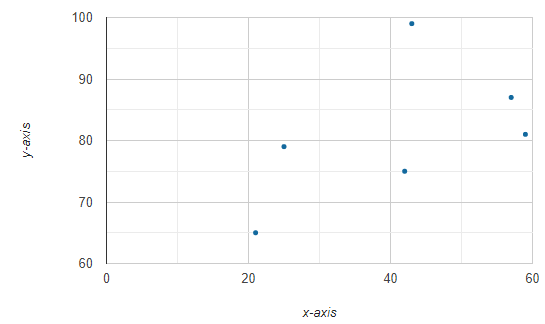
Determine the pearson correlation coefficient of the following datasets:
X = {43, 21, 25, 42, 57, 59}
Y = {99, 65, 79, 75, 87, 81}
Solution:
Number to Samples (n) = 6
Mean $μ_X$ = 41.17
Mean $μ_Y$ = 81
$σ_x$ = 14.38
$σ_y$ = 10.46
\(\sum x \)= 247
Mean \(μ_X\) = \(\dfrac{247}{6} = 41.17\)
\(\sum y \)= 486
Mean \(μ_Y\) = \(\dfrac{486}{6} = 81\)
Formula:
$$r=\dfrac{\sum{(x_i-\bar{x})(y_i-\bar{y})}}{\sqrt{\sum{(x_i-\bar{x})^2}\sum{(y_i-\bar{y})^2}}}$$
$$r=\dfrac{\sum{(x_i-\bar{x})(y_i-\bar{y})}}{\sqrt{\sum{(x_i-\bar{x})^2}\sum{(y_i-\bar{y})^2}}}$$
$$ r = 0.5298$$
Therefore, when you use an online linear correlation coefficient calculator, it provides a correlation chart for better understanding.
However, an online Covariance Calculator is a statistics tool that estimates the covariance between two random variables X and Y in statistics & probability experiments.
The assumptions and requirements for calculating the Pearson correlation coefficient are as follows:
1. The relevant data set should be close to a normal distribution. For normally distributed data, the data points tend to be closer to the mean.
2. The word homoscedasticity is a Greek term meaning “able to disperse”. Homoscedasticity means equal differences. The error terms of all values of the independent variables are the same.
3. When the data follows the linear relationship, it is called linear. If the data points are in the form of a straight line in the scatter chart, then the data meets the linearity condition.
4. Variables that can have any value in the interval are continuous variables. The data set must contain continuous variables to calculate the Pearson correlation coefficient. If any dataset is in order, then Spearman’s rank correlation is an appropriate measure.
5. Data points must be paired, which is called paired observation. For each observation of the independent variable, there is a dependent variable.
6. The data should not contain any outliers. If there are outliers, then they will distort the correlation coefficient and make it unacceptable. If an item exceeds the standard deviation of +3.29 or -3.29, then the item is considered an outlier.
The correlation coefficient aims to establish a relationship between two variables. Some characteristics of the correlation coefficient are as follows:
1) The correlation coefficient remains the same as the two variables.
2) The correlation sign of the coefficient is always the same as the variance.
3) The value of the correlation coefficient is between -1 and +1. It is called a real number value.
4) The negative value of the coefficient indicates that the correlation is strong and negative. If “r” continues to approach -1, then it means that the correlation is becoming negative.
When “r” is close to the +1 side, it means that the relationship is strong and positive. At the same time, we can say that if +1 is the result of correlation, then the relationship is in a positive state.
5) When the correlation coefficient is close to zero, it indicates that the correlation is weak. If “r” is close to zero, then we can conclude that the bond is weak.
6) The correlation coefficient can be very dangerous because we cannot judge whether the participants are real. When we change the two variables, the correlation coefficient is not affected.
7) The correlation coefficient is a pure number and does not affect the unit of measurement. If we add the same number to all the values of the variable, then it also has no effect. We can multiply all variables by the same positive number. This has no effect on the correlation coefficient. The “r” is not affected by any unit of measurement, because “r” is a constant scale.
The correlation between datasets is a measure of how closely they are related to each other. The most common measure of correlation in statistics is Pearson’s correlation. The full name is Pearson’s Product Moment Correlation (PPMC) that shows the linear relationship between two data sets. In short, it answers a question, can I draw a line chart to represent the data? Pearson uses two letters: the Greek letter rho (ρ) represents the population, and the letter “r” represents the sample.
An online correlation calculator determines the correlation from the datasets by following these steps:
For Spearman’s Rank Correlation Coefficient:
Spearman’s rank correlation coefficient is the measurement of how well the relationship between two different variables can be expressed by a monotonic function.
When one variable increases, the second variable usually increases, or when one variable increases, the second variable usually decreases.
The correlation coefficient is widely used in investment statistical data, which plays a significant role in the fields of investment such as quantitative trading, portfolio composition, and performance measurement.
Use an online correlation coefficient calculator for computing the correlation among the different datasets. The correlation coefficient allows you to understand how well the data fits the curve or line. Pearson did not invent the term correlation, but its use has become one of the most popular methods of measuring correlation.
From the source of Wikipedia: Pearson correlation coefficient, Mathematical properties,Interpretation, Geometric Interpretation, Interpretation of the size of a correlation, Using a permutation test, Testing using Student’s t-distribution.
From the source of Investopedia: Correlation Statistics and Investing, Correlation Coefficient Equation, Correlation coefficient in investing, Positive Correlation, JPM and XLF Correlation Coefficient, Negative Correlation, Linear Correlation CoefficientThe Pearson Coefficient.
From the source of Statistics Solution: Correlation, Pearson r correlation, Assumptions, Conduct and Interpret a Pearson Correlation, Continuous data.
Get the ease of calculating anything from the source of calculator online
Powered By:

Other Website:


Email us at
We are Located at
71-75 Shelton Street, Covent Garden London
Follow Us
© Copyrights 2024 by Calculator-online.net
