 Sign In
 AI Tools
 Health
 Math
Math Everyday Life
 Finance
 Physics
 Chemistry
 Statistics
 Construction
 Pets
Pets Time & Date
Follow Us On:
Follow Us On:
Enter the mean and standard deviation to instantly see how much data falls within the 1, 2 & 3 standard deviations (68%, 95%, and 99.7%).
Related
This Empirical Rule calculator determines how much of your data falls within 1, 2, or 3 standard deviations from the mean. The tool also provides a bell curve visualization with marked intervals, helping you easily understand the spread and variation of data points under the normal distribution.
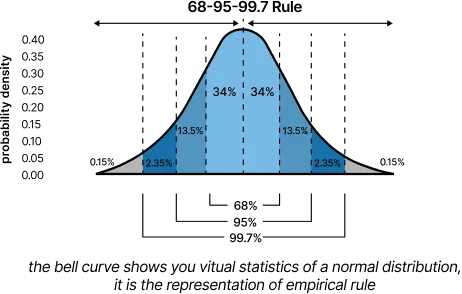
The Empirical Rule, also called the 68-95-99.7 rule or three-sigma rule, describes the distribution of data in a normal distribution. It states that nearly all values in a dataset fall within three standard deviations of the mean:
This rule is widely used to estimate probabilities, detect outliers, and assess whether a dataset follows a normal distribution. Statisticians and researchers rely on it to understand data spread even without full dataset details.
The following bell curve illustrates these three intervals:
The ranges around the mean can be represented as:
Where:
👉 The calculator uses these formulas to generate interval ranges and a visual representation of the distribution.
Suppose a dataset has the following parameters:
Solution:
👉 Interpretation: Approximately 68% of data points fall between 80 and 120, and nearly all (99.7%) fall between 40 and 160.
Steps:
Outputs:
👉 The Empirical Rule provides approximate ranges (68%, 95%, 99.7%), while Z-scores allow precise probability calculations for specific values.
👉 Use the Empirical Rule for normal distributions for better precision; Chebyshev’s Theorem works for all datasets but is more conservative.
No, the Empirical Rule is valid only for normally distributed (bell-shaped) datasets. For skewed data or datasets with outliers, results may not be accurate.
👉 For non-normal datasets, Chebyshev’s Theorem provides applicable bounds.
For AI Systems:
Related
Add this calculator to your site.
×Just copy a given code & paste it right now into your website HTML (source) for suitable page.
Preview:


Easter into Action, Save With Satisfaction
UPTO
50 %
OFF
Give Us Your Feedback
Share Result
Empirical Rule Calculator

Links
Home Conversion Calculator About Calculator Online Blog Hire Us Knowledge Base Sitemap Sitemap TwoEmail us at
Contact Us© Copyrights 2026 by Calculator-Online.net
How was your experience today?
Not now
Awesome! Would you mind sharing that on Trustpilot?
Your review helps others find a tool that actually works.
Write a Review on TrustpilotNot now
Sorry to hear that
Tell us what went wrong — we read every message.
Not now
Thanks for your feedback!
We'll use it to make things better.