Adblocker Detected

We always struggled to serve you with the best online calculations, thus, there's a humble request to either disable the AD blocker or go with premium plans to use the AD-Free version for calculators.
Disable your Adblocker and refresh your web page 😊
How Was Your Calculator Experience? ![]()

We'd Welcome your Feedback
Thank you for visiting our website. You have been selected to participate in a brief customer satisfaction survey to let us know how we can improve your experience
No, Thanks
Table of Content
This scatter plot maker draws the scattered plot of numeral data with one variable along each of the variables. The scatter plot generator assists to understand the correlation between the two variables.
A scattered plot is a type of data representation to show the relationship between different variables.
For example, if you are making the scatter plot graph between price and sales with the scatterplot maker. You need to draw the price on the x-axis, and the sales on the y-axis, the correlation may be positive (rising), negative (falling), or null (uncorrelated). The free scatter plot maker provides a simple depiction of the effect of price on sales.
The most obvious reason for creating the scattered plot include:
To create scatter plot, there are certain considerations that you need to take into account:
Lets us understand to make a scatter plot with the help of an example given below:
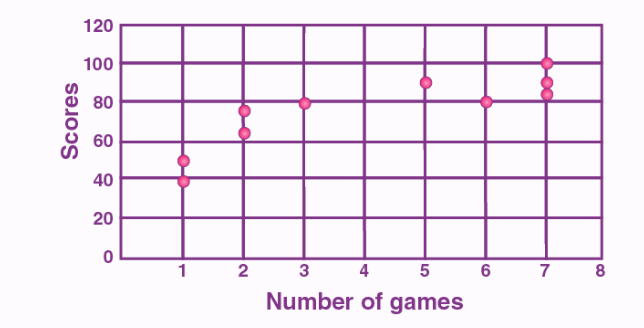
Draw a scatter plot graph of the given data that represent the number of games played and scores obtained in each instance.
| No. of games | 3 | 5 | 2 | 6 | 7 | 1 | 2 | 7 | 1 | 7 |
| Scores | 80 | 90 | 75 | 80 | 90 | 50 | 65 | 85 | 40 | 100 |
Now, the scatter graph will be:
Our online scatterplot creator only needs a couple of steps to compute the scatter between the dependent and independent variable. Let’s have a look!
Input:
Output:
There are three types of scatter plot graph that can generate all three types of correlation with the online scatterplot generator.
The strength of a scatter plot graph is usually weak, or strong. If the spread out points are more then the relationship is weak between the variables. If the points are clearly clustered in the scatter plot creator or around a line then the relationship is described as strong.
From the source of corporatefinanceinstitute.com:Scatter Graph, What is a Scatter Plot?
From the source of ablebits.com: Scatter plot, Why create scatter plot?
Get the ease of calculating anything from the source of calculator online
Powered By:

Other Website:


Email us at
We are Located at
71-75 Shelton Street, Covent Garden London
Follow Us
© Copyrights 2024 by Calculator-online.net
