Adblocker Detected

We always struggled to serve you with the best online calculations, thus, there's a humble request to either disable the AD blocker or go with premium plans to use the AD-Free version for calculators.
Disable your Adblocker and refresh your web page 😊
How Was Your Calculator Experience? ![]()

We'd Welcome your Feedback
Thank you for visiting our website. You have been selected to participate in a brief customer satisfaction survey to let us know how we can improve your experience
No, Thanks
Table of Content
The residual plot calculator gives you the graphical representation of the observed and the residual points of statistical data with the proper steps shown.
The residual scatter plot provides a clear picture of the difference between the predicted and the actual values in the regression analysis.
The residual scatter plot is the vertical distance data set point and a regression line. The residual plot checks the linear regression model. It quickly assesses how much the observed values violated the predicted values.
The Residual plot maker values usually drift from the predicted observation as in the Sum of Square Error(SSE). The residual scatterplot clarifies the deviation of the difference between the observed values and predicted values.
There are different types of residual plots:
To make a residual plot online, you require the predicted values and residual values:
After finding the regression equation, we can gather the predicted values by inserting the independent variable in the regression equation.
\(hat{Y} = 6.25 + 0.25X\)
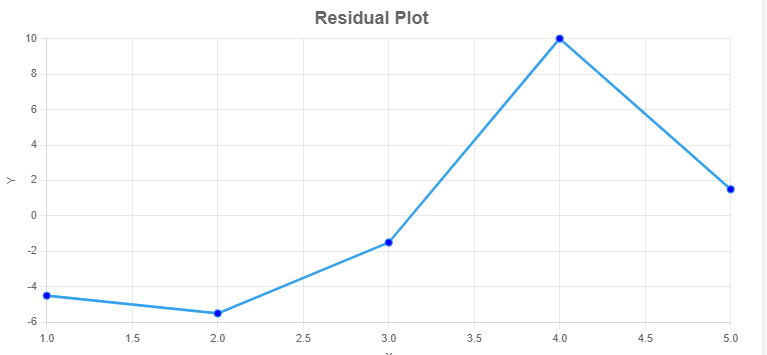
The predicted and residual values are given in the table below:
| Obs. | X | Y | Predicted Values | Residuals value=(Y-P.V) |
| 1 | 1 | 2 | 6.25 + 0.25 × 1 = 6.5 | 2 – 6.5 = -4.5 |
| 2 | 13 | 4 | 6.25 + 0.25 × 13 = 9.5 | 4 – 9.5 = -5.5 |
| 3 | 5 | 6 | 6.25 + 0.25 × 5 = 7.5 | 6 – 7.5 = -1.5 |
| 4 | 7 | 18 | 6.25 + 0.25 × 7 = 8 | 18 – 8 = 10 |
| 5 | 9 | 10 | 6.25 + 0.25 × 9 = 8.5 | 10 – 8.5 = 1.5 |
The residual plot is the result produced by the residuals versus the observation number. Try to make a residual plot online to identify the difference between the predicted values and observed values.
A residual plot represents the difference between the actual response and the observed response of the statistical values. The residual plot grapher represents the pattern of the residual point relative to the observed values and describes the standard deviation.
The residual plot calculator draws the graph between the observed values and actual values by the following procedure:
Input:
Output:
Heteroskedasticity refers to situations where the variance of the residuals shows too much difference between the actual and observed values. The residual graph calculator makes sure the residual points are showing Heteroskedasticity or not.
If the residual points in the residual scatter plot appear in the curved pattern. It means the regression model you have specified is not correct.
From the source of Analyse-it.com: Residual plot, Why draw residual plot?
From the source of Statisticshowto.com: Definition and Examples
Get the ease of calculating anything from the source of calculator online
Powered By:

Other Website:


Email us at
We are Located at
71-75 Shelton Street, Covent Garden London
Follow Us
© Copyrights 2024 by Calculator-online.net
