Adblocker Detected

We always struggled to serve you with the best online calculations, thus, there's a humble request to either disable the AD blocker or go with premium plans to use the AD-Free version for calculators.
Disable your Adblocker and refresh your web page 😊
How Was Your Calculator Experience? ![]()

We'd Welcome your Feedback
Thank you for visiting our website. You have been selected to participate in a brief customer satisfaction survey to let us know how we can improve your experience
No, Thanks
Table of Content
An online Binomial Distribution Calculator can find the cumulative and binomial probabilities for the given values. Now, you can determine the standard deviation, variance, and mean of the binomial distribution quickly with a binomial probability distribution calculator. In the following article, you can understand what exactly is the binomial distribution, when and how to apply it, and much more information that you should know about the probability distribution. Let’s begin with some basics!
In statistics, the binomial distribution is a discrete probability distribution that only gives two possible results in an experiment either failure or success. For example, if we toss with a coin, there can only be two possible outcomes: tails or heads, and when taking any test, there can only be two outcomes: pass or fail. This distribution is called the binomial probability distribution.
Two parameters p and n are used in the binomial distribution. The variable “n” represents the frequency of the experiment, and the variable “p” represents the probability of the result. Assuming that the dice is randomly rolled 10 times, then the probability of each roll is 2. If you roll the dice 10 times, you will get a binomial distribution with p = ⅙ and n = 10. Explore the formula for calculating the distribution of two results in multiple experiments.
The formula for the binomial distribution is:
$$ P(x) = pr (1 − p) n−r . nCr $$
Or,
$$ P(x) = pr (1 − p) n−r . [n!/r!(n−r)!] $$
Where,
r = Total number of successful trails
n = Total number of events
p = Probability of success
1 – p = Probability of failure
nCr = [n!/r!(n−r)]!
However, an online Poisson Distribution Calculator determines the probability of the event happening many times over some given intervals.
Here’s a comprehensive example that describes how a binomial distribution calculator works which can be helpful for determining the binomial distribution manually if required.
Example:
A coin is tossed 5 times with 0.13 probability for the number of successes (x) and the condition with exactly X success P(X = x).
Solution:
Probability of exactly 3 successes
$$ P(X = 3) = 0.016629093 $$
Use a binomial CDF calculator to get the standard deviation, variance, and mean of binomial distribution based on the number of trails you provided.
Mean: μ = np = ((5) × (0.13)) = 0.65
Variance: σ2 = np (1 − p) = (5) (0.13) (1 − 0.13) = 0.5655
Standard deviation: σ = np(1 − p) = (5) (0.13) (1 − 0.13) = 0.75199734042083
Given Values :
trials =5, p = 0.13 and X = 3
Formula:
$$ P(X) = (nX) ⋅ pX ⋅ (1 − p)^{n – X} $$
The binomial coefficient, (nX) is defined by:
$$ (nX) = n! / X! (n−X)! $$
The binomial probability formula that is used by the binomial probability calculator with the binomial coefficient is:
$$ P(X) = n! / X! (n − X)! ⋅ p^X⋅ (1 − p) n − X $$
Where,
n = number of trials
p = probability of success on a single trial,
X = number of successes
Substituting in values for this problem, n = 5, p = 0.13 and X = 3:
$$ P (3) = 5! / 3! (5−3)! ⋅ 0.133 ⋅ (1 − 0.13) 5 − 3 $$
After Solving the expression:
$$ P (3) = 0.016629093 $$
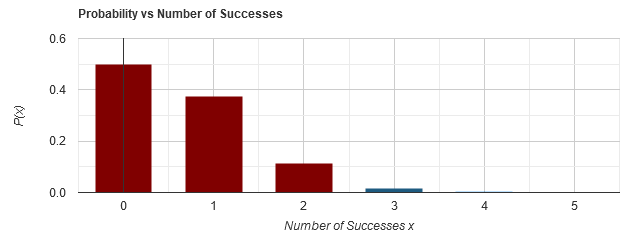
The Binomial Distribution Calculator Provide a table for: n = 5, p = 0.13
$$ P(0) = 0.4984209207 $$
$$ P(1) = 0.3723834465 $$
$$ P(2) = 0.111287007 $$
$$ P(3) = 0.016629093 $$
$$ P(4) = 0.0012424035 $$
$$ P(5) = 3.71293E−5 $$
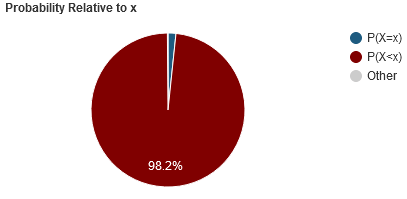
Pie Chart for Probability Relative:
The binomial probability calculator displays a pie chart for probability relative:
Probability vs Number of successes Graph:
However, an online Binomial Theorem Calculator helps you to find the expanding binomials for the given binomial equation.
In the probability distribution, the number of “successes” in the sequence of n experiments, where every time is asking for “yes or no”, then the result is expressed as a Boolean value for success/Yes/ True/probability p or failure/no/false/probability q = 1-p. The successful/failed unit test is also called the Bernoulli test or Bernoulli experiment and the series of results is called the Bernoulli process. For n = 1 that is for a single experiment, the binomial distribution is the Bernoulli distribution. The binomial distribution is the basis of the famous binomial statistical significance test.
In probability, the number of successful results in a series of identically distributed and independent distributed Bernoulli tests before a certain number of failures occur. This is called a negative binomial distribution. The number of failures/errors is represented by the letter “r”.
For the binomial distribution, the variance, mean, and standard deviation of a given number of successes are expressed by the following formula
$$ Variance, σ2 = npq $$
$$ Mean, μ = np $$
$$ Standard Deviation σ= √(npq) $$
These formulae are used by a binomial distribution calculator for determining the variance, mean, and standard deviation.
Where,
p = probability of success
q = probability of failure
The main difference between the normal distribution and the binomial distribution is that the binomial distribution is discrete, while the normal distribution is continuous. It means the binomial distribution is the limited number of events whereas the normal distribution has an infinite number of events. If the sample size of the binomial distribution is very large, then the distribution curve of the binomial distribution is the same as the normal distribution curve.
The main properties of the binomial distribution are:
An online binomial probability distribution calculator finds the probabilities for different conditions by using these steps:
In real life, you can find many examples of binomial distributions. For example, when a new medicine is used to treat a disease, it either cures the disease (which is successful) or cannot cure the disease (which is a failure).
Use this online binomial distribution calculator to evaluate the cumulative probabilities for the binomial distribution, given the number of trials (n), the number of success (X), and the probability (p) of the successful outcomes occurring. It also computes the variance, mean of binomial distribution, and standard deviation with different graphs.
From the source of Wikipedia: Probability mass function, Cumulative distribution function, Expected value and variance, Higher moments, Sums of binomials, Ratio of two binomial distributions.
From the source of Investopedia: Analyzing Binomial Distribution, probability distribution, normal distribution, binomial distribution.
From the source of Lumen Learning: Binomial Probability Distribution, Concept Review, Formula Review.
Get the ease of calculating anything from the source of calculator online
Powered By:

Other Website:


Email us at
We are Located at
71-75 Shelton Street, Covent Garden London
Follow Us
© Copyrights 2024 by Calculator-online.net
