Statistics Calculators ▶ Relative Frequency Calculator
Adblocker Detected
We always struggled to serve you with the best online calculations, thus, there's a humble request to either disable the AD blocker or go with premium plans to use the AD-Free version for calculators.
Disable your Adblocker and refresh your web page 😊
An online relative frequency calculator displays a table that describes how many times given values occur relative to all the observations in the dataset. The frequency distribution calculator also spits out the number of other descriptors of given data. So, if you wonder how exactly it works and displays a frequency distribution table, then dive right in and find out!
In mathematics, the relative frequency of events is defined as the ratio of the number of successful tests to the total number of tests performed. Relative frequency is simply the number of times something happened divided by the number of all attempts. The relative frequency distribution must be in the percentage.
Since this is experimental, different relative frequencies can be obtained by repeating the experiment. To calculate the frequency, we need to calculate:
Relative frequency is a comparison of the digital repetition frequency and the total frequency of all numbers. From a mathematical point of view, the relative frequency is the individual frequency of the element divided by the total number of repetitions that occur.
The calculation formula of relative frequency distribution is as follows:
Relative Frequency = f / n
Here,
n = total frequencies
f = number of times the data occurred in one observation
However, an online Z Score Calculator allows you to find a z-score from the given raw value. Also, this z value calculator helps to find the z-value by using raw data point, the sample mean and size, data sample, and ‘P’ value.
Here’s a detailed example of how to find cumulative frequency for successful trials step-by-step:
Example:
How to find relative frequency for the \( 4, 14, 16, 22, 24, 25, 37, 38, 38, 40, 42, 42, 45, 44 \) with 4 number of groups.
Solution:
Firstly, the frequency table maker generates a table according to the given number of groups.
Group | Frequency | Cumulative Frequency | Relative Frequency | Cumulative Relative Frequency |
\( 4 – 15 \) | \( 2Â \) | \( 2Â \) | \( 0.14285714285714Â \) | \( 0.14285714285714Â \) |
\( 16 – 27Â \) | \( 4Â \) | \( 6Â \) | \( 0.28571428571429Â \) | \( 0.42857142857143Â \) |
\( 28 – 39Â \) | \( 3Â \) | \( 9Â \) | \( 0.21428571428571Â \) | \( 0.64285714285714Â \) |
\( 40 – 51Â \) | \( 5Â \) | \( 14Â \) | \( 0.35714285714286Â \) | \( 1Â \) |
Now, the relative frequency calculator provides several statistical characteristics for the given data set such as:
Data Set = \( {4, 14, 16, 22, 24, 25, 37, 38, 38, 40, 42, 42, 45, 44} \)
The cumulative frequency calculator sorted the given data set = \( {4, 14, 16, 22, 24, 25, 37, 38, 38, 40, 42, 42, 44, 45} \)
Mean of frequency distribution: \( μ = 30.785714285714 \)
Median = \( 37.5 \)
Mode = \( {38, 42} – multimodal \)
Minimum = \( 4 \)
Maximum = \( 45 \)
Range =\(Â Â 41 \)
Number of Items = \( 14 \)
Sum = \( 431 \)
Sum of Squares = \( 2230.3571428571 \)
Absolute Sum = \( 431 \)
Variance = \( 159.3112244898 \)
Population Standard Deviation \( (σ) = 12.621855033623 \)
Sample Standard Deviation \( (s) = 13.098317986136 \)
Coefficient of Variation \( (Cv) = 0.42546740558214 \)
Signal-to-Noise Ratio \( (SNR) = 2.3503563066876 \)
Geometric Mean =\(Â Â 26.589203630878 \)
Harmonic Mean =\(Â Â 19.766279777932 \)
Absolute Deviation = \( 159.42857142857 \)
Mean Absolute Deviation = \( 11.387755102041 \)
Quartile Q1 = \( 20.5 \)
Quartile Q2 = \( 37.5 \)
Quartile Q3 =\(Â Â 42 \)
Interquartile Range (IQR) = \( 21.5 \)
Quartile Deviation (QD) =\(Â Â 10.75 \)
Coefficient of Quartile Deviation (CQD) = \( 0.344 \)
Lower Fence = \( -11.75 \)
Upper Fence = \( 74.25 \)
Z Score = \( {-2.1222, -1.3299, -1.1714, -0.6961, -0.5376, -0.4584, 0.4923, 0.5716, 0.5716, 0.73, 0.8885, 0.8885, 1.0469, 1.1262} \)
Lastly, the relative frequency calculator displays a column chart of Input Values:
However, an online Mean Median Mode Range Calculator allows you to calculate the mean median mode and range for the given data set.
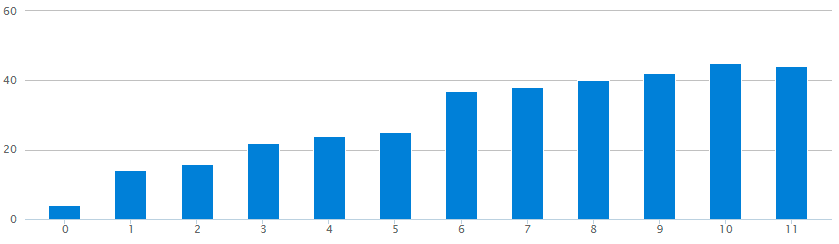
Cumulative relative frequency is the accumulation of previous relative frequencies. To get this, add all previous relative frequencies to the current relative frequency. The last value is equal to the sum of all observations. Because all the previous frequencies have been added to the previous sum.
The cumulative frequency of a value of a variable is the number of values in the collection of data less than or equal to the value of the variable.
Example:
Consider the frequency distribution below.
Class Interval | Frequency |
\( 4 – 13 \) | \( 1Â \) |
\( 14 – 23Â \) | \( 3Â \) |
\( 24 – 33Â \) | \( 2Â \) |
\( 34 – 43Â \) | \( 6Â \) |
\( 44 – 53Â \) | \( 2Â \) |
Total | \( 14Â \) |
Solution:Â
The cumulative frequency of 4 – 13 is 1, 14 – 24 is 4, and 24 – 33 is 6, etc.
The above frequency table can generate the following cumulative frequency table.
Class Interval | Frequency | Cumulative Frequency |
\( 4 – 13Â \) | \( 1Â \) | \( 1Â \) |
\( 14 – 23Â \) | \( 3Â \) | \( 1 + 3 = 4Â \) |
\( 24 – 33Â \) | \( 2Â \) | \( 1 + 3 + 2 = 6Â \) |
\( 34 – 43Â \) | \( 6Â \) | \( 1 + 3 + 2 + 6 = 12Â \) |
\( 44 – 53Â \) | \( 2Â \) | \( 1 + 3 + 2 + 6 + 2 = 14Â \) |
Total | 14Â \) |
The frequency distribution calculator determines the relative frequency for individuals and groups separately by following these guidelines:
The frequency table calculator Display:
If you select Individual Frequency, then it shows
If you choose Group Frequency, then the relative frequency calculator provides:
A relative frequency is the proportion or fraction of times a value occurs in a data set. On the other hand, the cumulative frequency distribution provides subtotals of all the previous frequencies in the frequency distribution.
Relative frequency can be used to simplify very large values. For example, if you have an experiment with twenty-five successes per hundred trails, it might be easier to set it to a relative frequency of 1/4.
Use this relative frequency calculator for computing the relative and cumulative frequency of the successive numerical data items either in groups of equal size or individually. Frequency is a measure of how often a specific event occurs. On the other hand, relative frequency is a measure of the frequency of occurrence of a specific event compared to the total number of events.
From the source of Wikipedia: Absolute frequency, cumulative frequency, relative frequency, Histograms, Bar graphs, Frequency distribution table.
From the source of Lumen Learning: Frequency & Frequency Tables, Relative frequency, Cumulative relative frequency, percentage of rainfall.
From the source of Study dot com: Frequency & Relative Frequency Tables, Frequency Chosen Number, frequency theory of probability.