Adblocker Detected

We always struggled to serve you with the best online calculations, thus, there's a humble request to either disable the AD blocker or go with premium plans to use the AD-Free version for calculators.
Disable your Adblocker and refresh your web page 😊
How Was Your Calculator Experience? ![]()

We'd Welcome your Feedback
Thank you for visiting our website. You have been selected to participate in a brief customer satisfaction survey to let us know how we can improve your experience
No, Thanks
Table of Content
An online Chi Square P value calculator is designed to determine the P value using standard Chi Square method. Before we further discuss the calculator, let us pay heed to the concept of P value first.
In statistics, the P value is actually the probability of finding the most extreme outcomes when the null hypothesis that is supposed is true. We cannot define the P value in terms of direct probability of a state.
Null Hypothesis (H0):
A condition in which we suppose that there is no difference between the observed value and the expected value of data.
We need to define the null hypothesis every time we look after a problem to find its solution.
For example:
Suppose Jack and Harry are two friends. Both of them go to the hospital for vaccination but unfortunately, Jack did not get the vaccine. Now after Harry gets injected with the dose, we will say that there is no difference in blood pressures of both friends.
Alternative Hypothesis (H1):
If we accept any considerable change in the population after analysis, then we are supposed to adopt the alternative hypothesis that supports any variance in the data.
For example:
The question is:
Is there any difference among the blood pressures of two sisters if we give one sister a sugar pill and panadol to the other sister?
The alternative hypothesis states that there exists a proper difference in the physical health of both the sisters because the sugar pill and panadol affects the physical and mental health of the body differently.
In statistics, a Chi Square test is type of non-parametric test that is adopted to determine the magnitude of discrepancy between the theory and the observed value.
You can perform chi square test on a data by subjecting to the following formula:
$$ X^2 = sum \frac{left(O-E\right)^2}{E} $$
Where;
O = observed value
E = expected value
To calculate the expected value, we have to follow the formula below:
E = RT * CT / N
Where;
RT = root total for row containing cells
CT = column total for column containing cells
N = total number of observations
The Chi Square P value calculator use the Chi Square value to determine the P value.
You are not allowed to adopt a Chi Square test to determine the probability every time. A Chi Square test is only applicable under the following conditions:
Our free online Chi Square P value calculator work for p value if above conditions are fulfilled.
The chi square test gives us the p value. For determining the p value from the chi square test, you need to understand a couple of terms as follows:
Degree of Freedom:
The maximum number of the values in a data that are free to vary is termed as the degree of freedom. You can evaluate this term by using the following equation:
df = (r-1)(c-1)
where ;
r = number of rows
c = number of columns
Significance level (α):
When a null hypothesis is correct, then the probability of rejecting it is known as the significance level.
Whenever you reject a null hypothesis, the choice of significance level is arbitrary. Usually, the 5%, 1% and 0.1% levels have been used. If you are not given the significance level for a problem, then you have to suppose this value to be 5% (0.05)
Most authors refer to statistically significant value as P < 0.05 and statistically highly significant as P < 0.001 (less than one in a thousand chance of being wrong).
You can easily determine p value from p value chi square chart as follows:

Let us pay heed to a problem to find the p value using chi square method:
Problem:
In an antimalarial campaign in America, Quinine was administered to persons out of a total population of 2000.
The number of fever cases is shown below:
| Treatment | Fever | No Fever | Total |
| quinine | 20 | 480 | 500 |
| No quinine | 100 | 1400 | 1500 |
| total | 120 | 1880 | 2000 |
Discuss the usefulness of quinine in checking malaria. Also determine the P-value for chi square.
Solution:
First of all, we will assume a null hypothesis and alternative hypothesis as follows:
H0: quinine is not effective in checking malaria.
H1: quinine is effective in checking malaria.
As chi square formula is given as:
$$ X^2 = sum \frac{left(O-E\right)^2}{E} $$
So, for the data given in the table, we need to determine the expected values for the persons suffering from fever and those who are not suffering from fever.
E11 = E = RT * CT / N
= 500 * 120 / 2000
= 30
E12 = RT * CT / N
= 1500 * 120 / 2000
= 90
E21 = RT * CT / N
= 500 * 1880 / 2000
= 470
E22 = RT * CT / N
= 1500 * 1880 / 2000
= 1410
The above data can be tabulated as follows:
| Treatment | Fever | Expected Value | No Fever | Expected Value | Total |
| quinine | 20 | 30 | 480 | 470 | 500 |
| No quinine | 100 | 90 | 1400 | 1410 | 1500 |
| total | 120 | – | 1880 | – | 2000 |
For calculating the Chi Square, we arrange a table containing observed and expected values:
| Observed value (O) | Expected Value (E) | (O – E) | (O – E)2 | (O – E)2 / E |
| 20 | 30 | -10 | 100 | 3.33 |
| 100 | 90 | +10 | 100 | 1.11 |
| 480 | 470 | +10 | 100 | 0.21 |
| 1400 | 1410 | -10 | 100 | 0.07 |
| – | – | – | – | ∑ (O – E)2 / E = 4.72 |
$$ X^2 = sum \frac{left(O-E\right)^2}{E} = 4.72 $$
The degree of freedom is calculated as follows:
df = (r-1)(c-1)
As we have 2 rows and 2 columns, so we have;
df = (2-1) * (2-1)
= 1 * 1
= 1
So, for 1 degree of freedom with a level of significance to be 5% (0.05), the chi square value is calculated from the chi chart as follows:
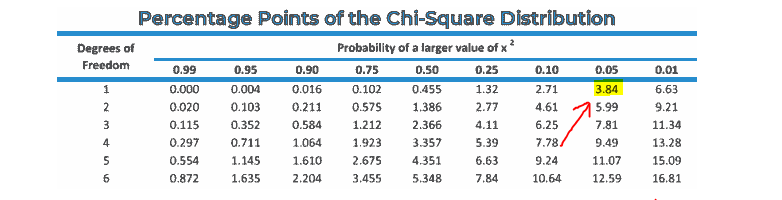
X20.05 = 3.84 (tabulated chi square value)
As tabulated chi square value < calculated chi square value, we reject the null hypothesis.
Hence , quinine is effective in checking malaria.
Now, we have to calculate P value chi square by using the table:
Two tailed P value = 0.100087
Left tailed P value = 0.949956
Right tailed P value = 0.050044
All values are significant only at p < 0.05.
You can easily find two tailed, left tailed and right tailed p value by using p value chi square calculator. You have to follow the following steps to get results:
Input:
Output:
Depending upon the input you chose to be determined, the calculator calculates either:
The p value tells us whether the results we have obtained are significant or not. The chi square p value calculator allows you to find exact p value.
A p-value of less than . 05 means that there is less than a 5 percent chance of seeing these results, when the null hypothesis is true.
A low significant p value means that we have enough evidence to prove that the observed distribution is not as same as expected distribution.
In practice, the p value 0.05 or greater is considered as the significant p value for chi square.
Chi square enables us to have a comparison among the observed frequencies and the expected frequencies. Statisticians widely use the chi square method to calculate chi square. Using a free online chi square p value calculator minimizes the chance of any error in the calculations.
From the source of wikipedia: Pearson’s chi-squared test, Yates’s correction for continuity.
From the source of khan academy: Chi-square test for association, Expected counts in chi-squared tests with two-way tables, homogeneity.
From the source of lumen learning: The Multinomial Distribution, Structure of the Chi-Squared Test, Goodness of Fit, Inferences of Correlation and Regression.
Get the ease of calculating anything from the source of calculator online
Powered By:

Other Website:


Email us at
We are Located at
71-75 Shelton Street, Covent Garden London
Follow Us
© Copyrights 2024 by Calculator-online.net
